


Hello lovely friends!
I hope you have all been loving my second grade math packets because I have a new one for you that’s all about data and graphing.
Data and graphing in second grade has students become familiar with representing and interpreting data with tally marks, bar graphs, picture graphs and line plots.
I have always loved teaching data and graphing because it’s a concept that can easily be taught in a hands-on way. Understanding what data is and how to organize it is really important and graphing allows students to organize that data while practicing their sorting and observation skills!
The Worksheets
There are over 40 activities included in this packet with many of them being interactive. Plus, I have included some differentiation options too, so if you have students working at a lower or higher level, there’s a bunch of activities for them too.
Here is a list of EVERYTHING this packet includes:
♥ Tally Marks (to 30)
♥ Counting Tally Marks (to 50)
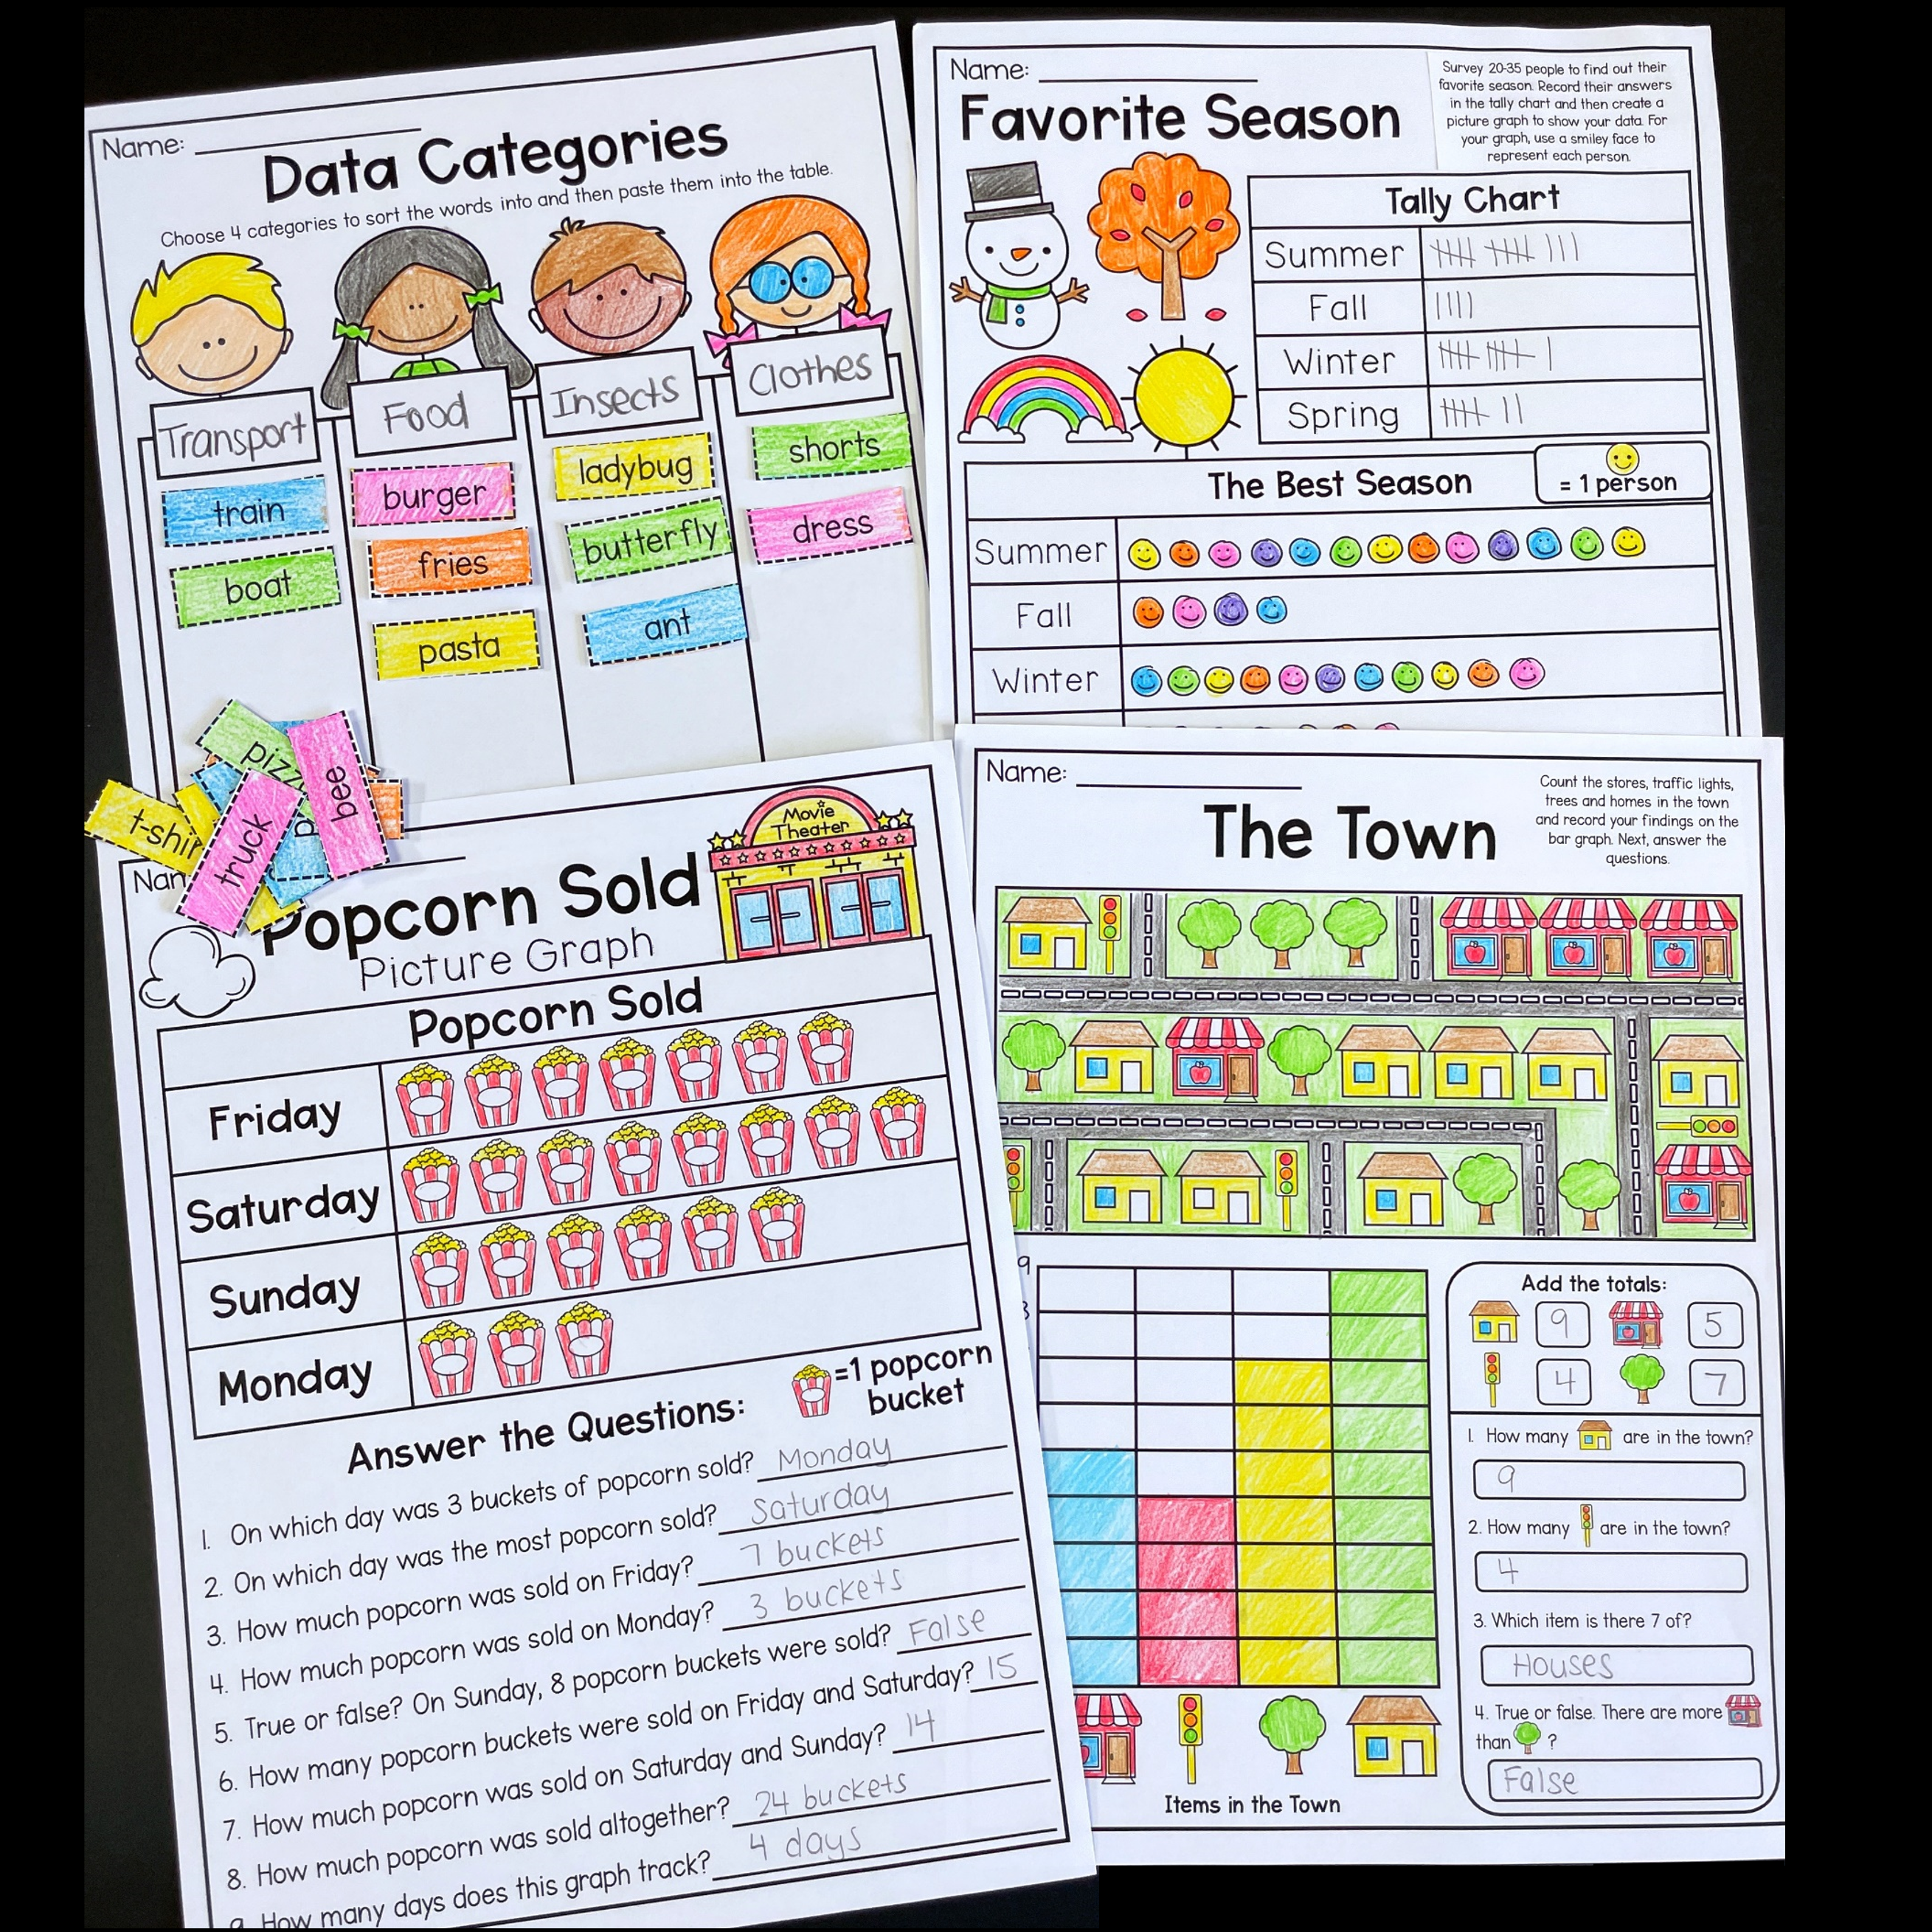
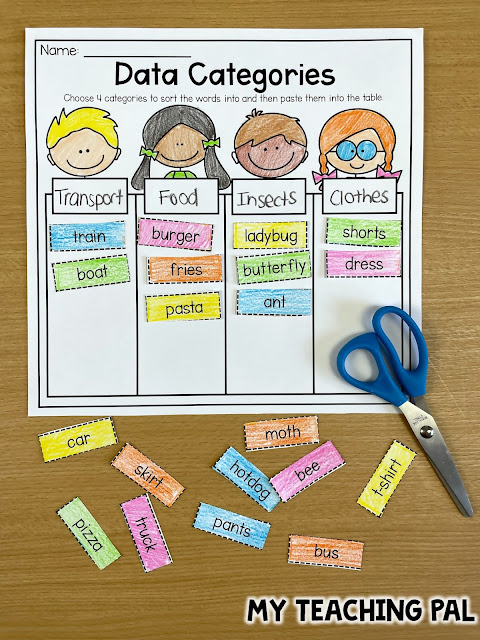
♥ Data Categories
♥ Categorize and Graph
♥ Pencil Tally Chart
♥ Ice Cream Shop
♥ Car Tally and Graph
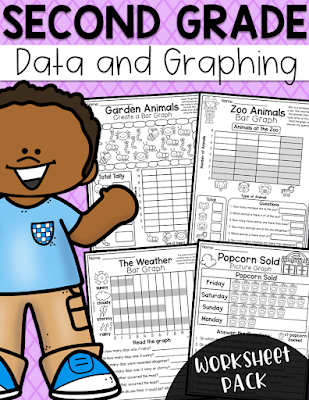
♥ Zoo Animal Bar Graph
♥ Weather Bar Graph
♥ Spelling Test Bar Graph
♥ Coffee Shop True or False
♥ Label a Graph
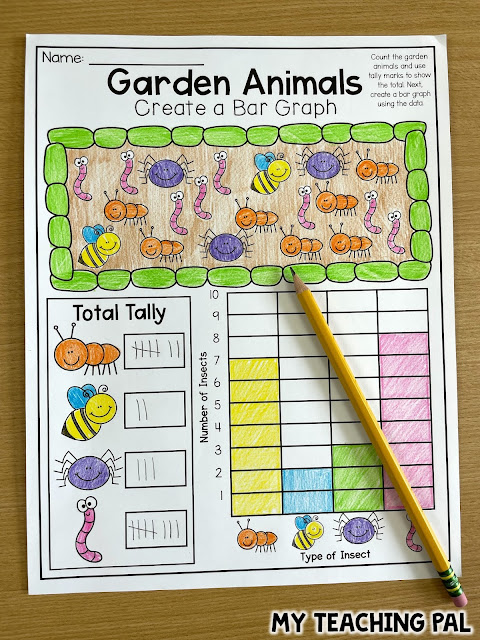
♥ Garden Animal Graph
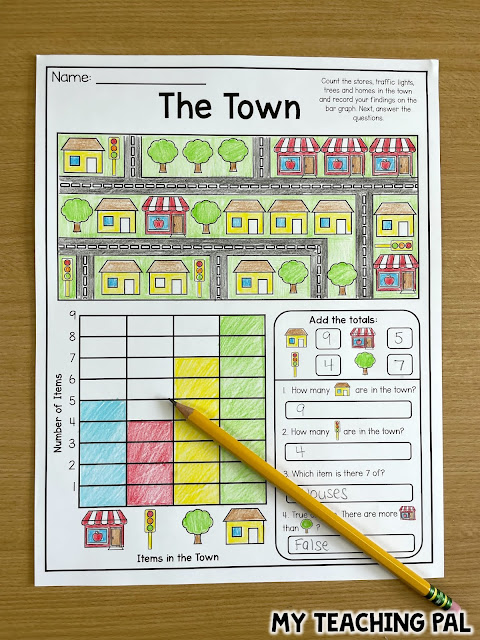
♥ Town Graph
♥ Clothes Shop
♥ Roll a Dice Data Collection
♥ Restaurant Bar Graph
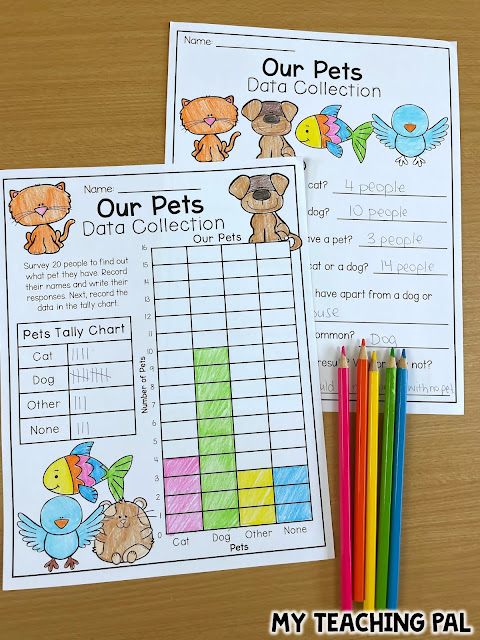
♥ Our Pets Data Collection
♥ Favorite Food Collect and Graph
♥ Ben’s Toy Chest Picture Graph
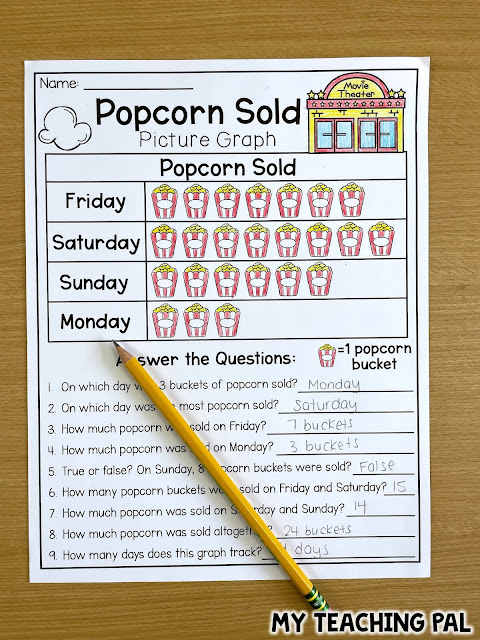
♥ Popcorn Sold Picture Graph
♥ Fishing Time Picture Graph
♥ T-Shirts True or False
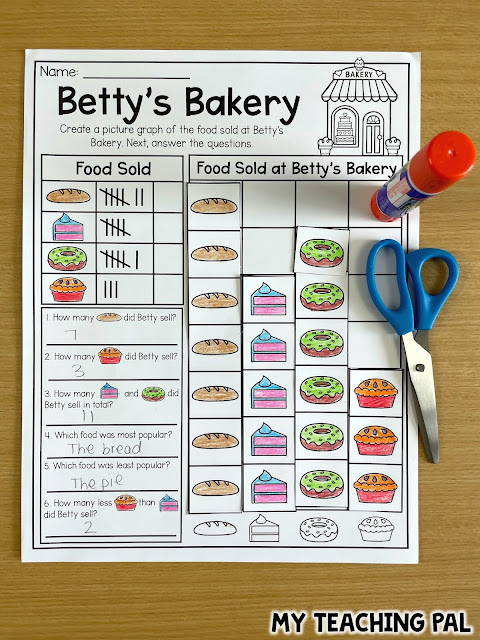
♥ Betty’s Bakery Graph
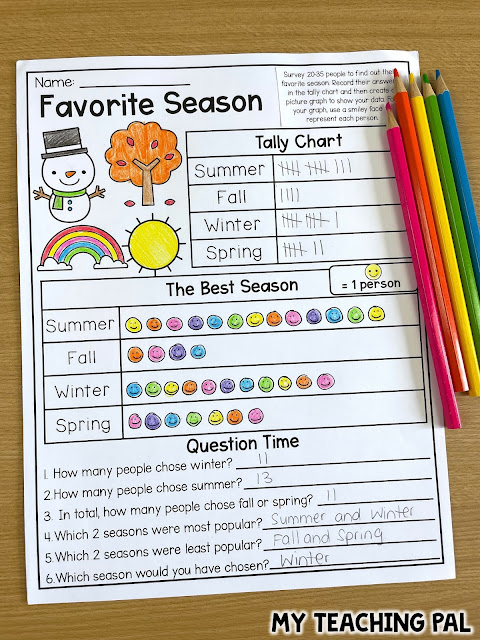
♥ Favorite Season Data Collection
♥ Fruit Line Plot
♥ Ribbon Length Line Plot
♥ School Trip True or False
♥ Tree Height Line Plot
♥ Cubes Line Plot
♥ Bugs Line Plot
♥ Pencil Length Data Collection
♥ Favorite Sea Animal Data Collection
♥ Data Collection Project
Data and Graphing Learning Activities
There are a number of different data and graphing learning activities that students should be given as well as concepts they should learn to help them gain a holistic understanding.
1. Tally Marks
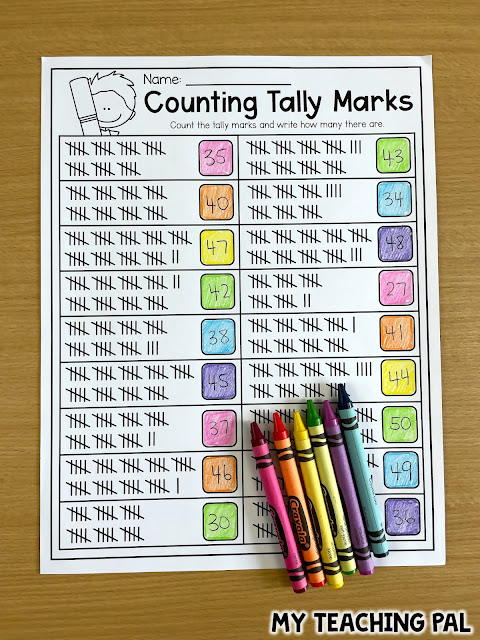
Students are introduced to tally marks in kindergarten and first grade, so it’s really important to review this concept because the basis of many data collection activities require tally mark knowledge. In the classroom, I would always use tally marks informally wherever I could so that students could see how they’re used in real life. If we did a class vote, or if I was required to count anything up, I’d use tally marks to display my data. Within this packet, I have included lots of opportunities for students to become
familiar with counting and recording tallies both as a standalone activity and as a part of a data collection activity.
2. Bar Graphs
Bar graphing activities are just so fun and are usually covered in depth in kindergarten and first grade. In second grade, bar graphs become trickier as students are required to draw and interpret graphs with four categories. The packet includes a range of activities that will allow your students to not only represent their data in a bar graph but also to read and answer questions based on a graph.
3. Picture Graphs
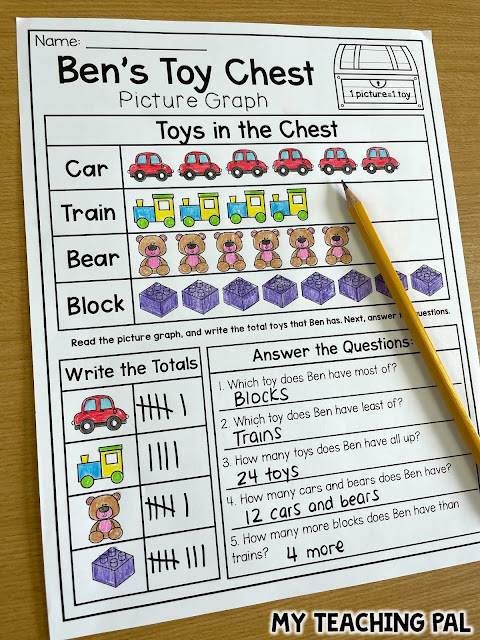
Picture graphs are another favorite of mine, especially with younger learners. Students love looking at the pictures and symbols to organize and understand data. Picture graphs also help students practice their subitizing skills because they can quickly recognize the objects. The packet includes so many diverse activities for picture graphs. Students will have opportunities to not only interpret picture graphs but also
collect and represent their data using picture graphs too!
4. Line Plots
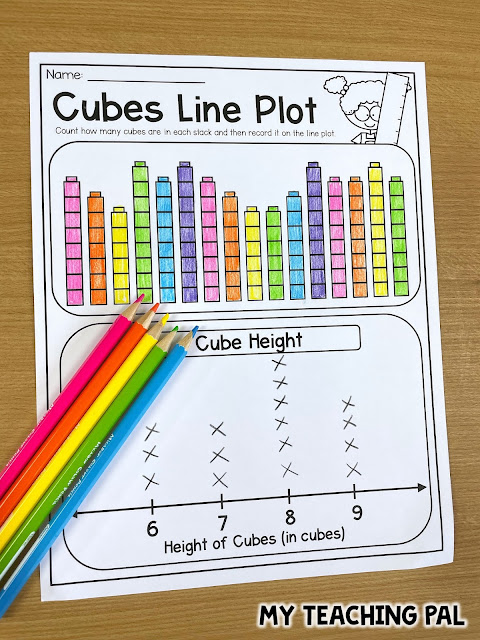
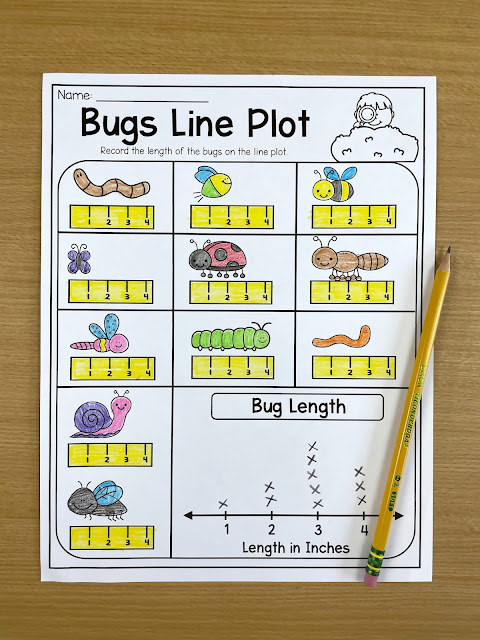
Lines plots are a new concept to second graders so extra instruction will be needed. The great thing is that students already have foundational knowledge about bar graphs and picture graphs so this can help
them understand how line plots work too. Common Core specifies that students should measure objects to create line plots, so I have added a range of learning opportunities for this. I have also added extra learning opportunities that don’t relate to measurement so that students can see the many ways
that line plots can be used.
There are so many other activities included in the packet that will help give your students a deeper understanding of data and graphing.
If you’d like to purchase this place value packet or find out more details, you can grab it here or click on the link below.


Leave a Comment